
1 Introduction
Brain-Computer Interfaces (BCIs) enable direct communication between the brain and external devices. These systems are useful in various applications, particularly in assisting individuals with physical disabilities, such as paralysis. BCIs can interpret neural signals and translate them into commands for computers or other devices, allowing users to control technology without physical movement. This capability is necessary for individuals who are unable to use conventional input methods like a mouse and keyboards, touchscreen, or eye-tracking systems due to their disability. In such cases, covert attention, whereby a person focuses mentally without any overt physical movement, can still be utilised to operate BCI systems. By detecting subtle changes in brain activity associated with attention, BCIs can provide a means for these individuals to interact with their environment, communicate, and perform daily tasks, thereby significantly improving their autonomy in using computers.
The objective of this research is to enhance the efficacy of BCIs by exploring a new noise-based tagging method. This method has the potential to offer more robust and precise signal extraction, while improving the accessibility of the BCIs.
1.1 Context
The study of neurophysiological data tagging through steady-state evoked visual potentials (SSVEP) has become a common method used for BCI systems. This method entails the presentation of visual stimuli, designated as “tags” at specific frequencies, which then elicit corresponding frequency-specific responses in the brain’s electrical activity, discernible through electroencephalogram (EEG) signals. As tags are associated with a part of the screen, the tags can be matched to a corresponding action on the computer, for example, pressing a button or moving a cursor. The relevance of SSVEP in BCIs lies in its ability to provide a non-invasive and efficient means of interpreting user intentions based on brain activity, enabling direct communication between the brain and external devices.
Conventional tagging techniques use low-frequency stimuli, which are perceptible to the user as “flicker.” These methods can induce fatigue in the user, as they necessitate sustained focus on the stimuli, which may not be optimal for BCIs, given that users may want to use computers for extended periods. Additionally, these lower frequencies can interfere with endogenous brain oscillations, complicating data interpretation (Haegens and Zion Golumbic 2018).
1.2 State of the Art: Use of RIFT for SSVEP
To address the challenges of using low-frequency stimuli as tagging techniques in BCIs, as described in the previous section, Rapid Invisible Frequency Tagging (RIFT) has emerged as a promising alternative. RIFT employs high-frequency stimuli that are imperceptible to human vision, thus avoiding the visual fatigue associated with traditional methods. This approach not only reduces user strain but also minimises interference with natural brain oscillations, whilst retaining a measurable neural response (Arora et al. 2024).
Similarly, Brickwedde et al. (2022) applied RIFT in BCIs and found that it significantly improved the accuracy and usability of these systems by reducing visual strain and enhancing the temporal resolution of neural response decoding. These findings indicate that RIFT can provide robust and precise tagging, making it a promising tool for BCI applications. However, RIFT is limited by the available frequencies. Low frequencies are difficult because they are not invisible to the user, and high frequencies elicit a weak response in the brain. Furthermore, frequencies cannot be close in frequency, since that makes them hard to tell apart.
1.3 Research Question
The objective of this research is to expore methods to enhance the user experience and reliability of BCIs. This thesis builds on the findings of the RIFT studies to explore the feasibility and effectiveness of utilising noise tagging. In particular, this study aims to address the following research questions:
- Are noise-based tags extractable from EEG data?
- Can multiple noise-based tags be used to see where a user is directing covert attention?
1.4 Hypothesis
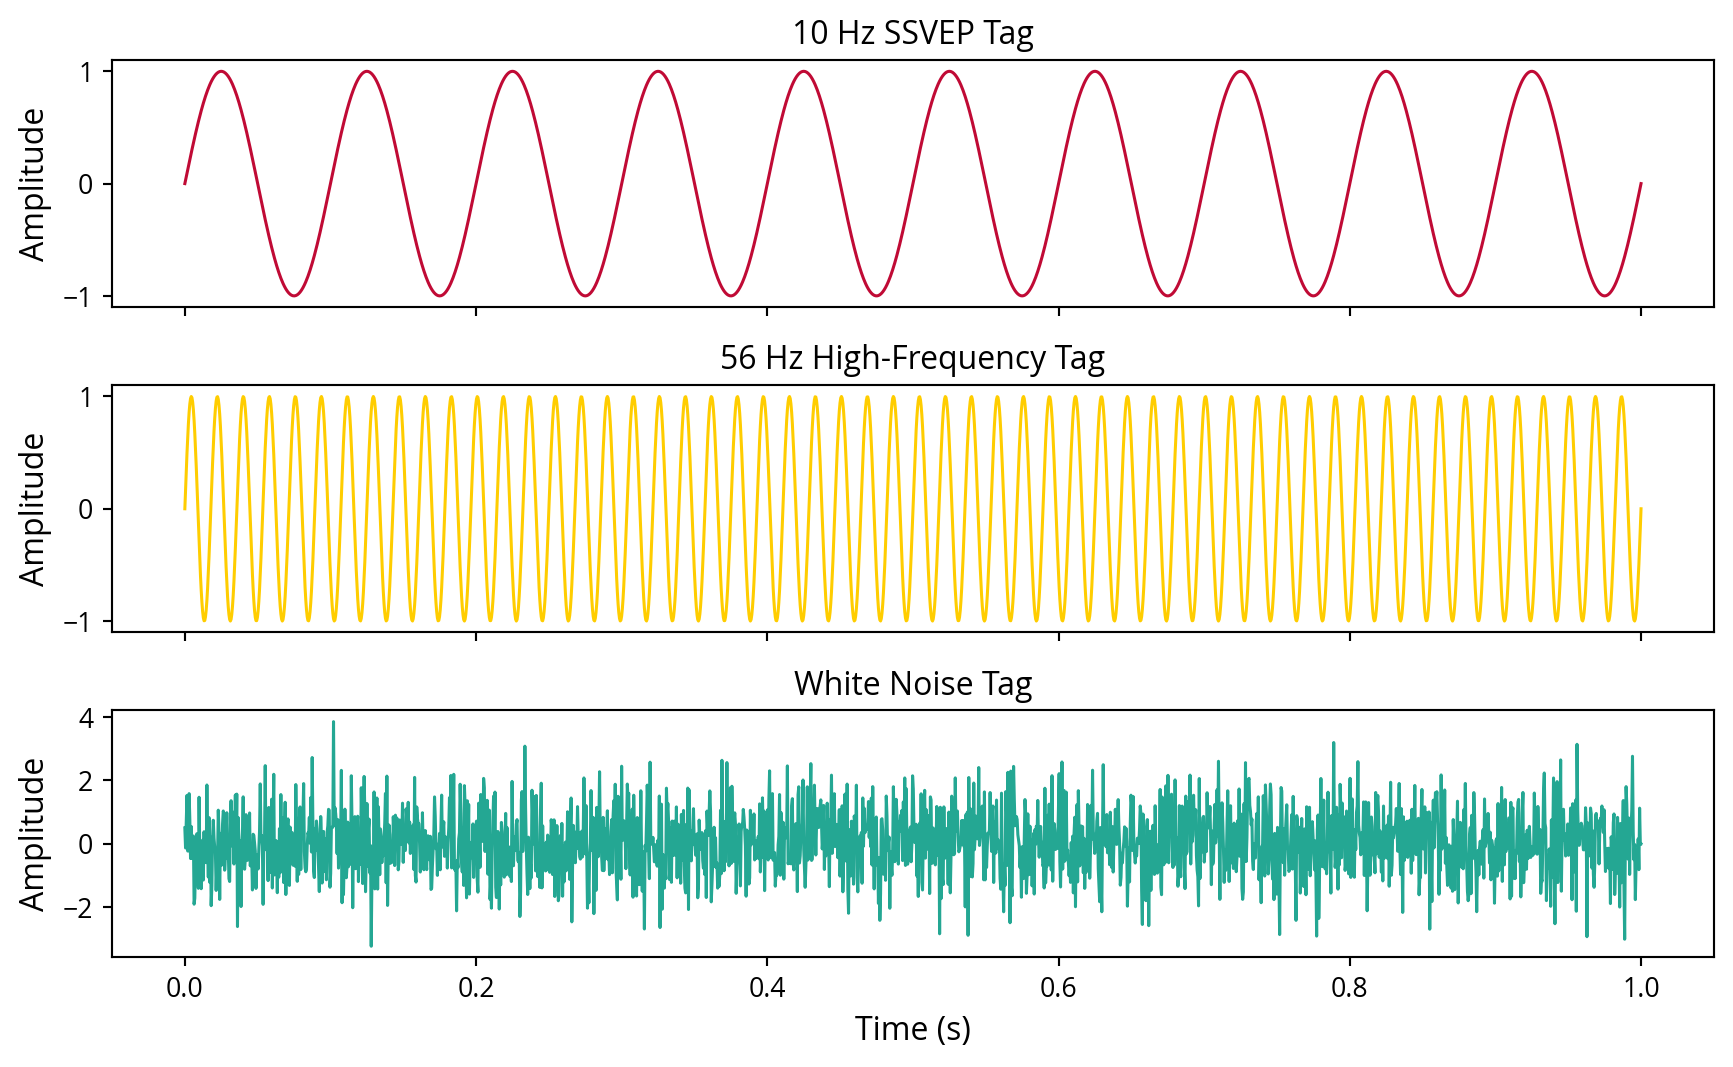
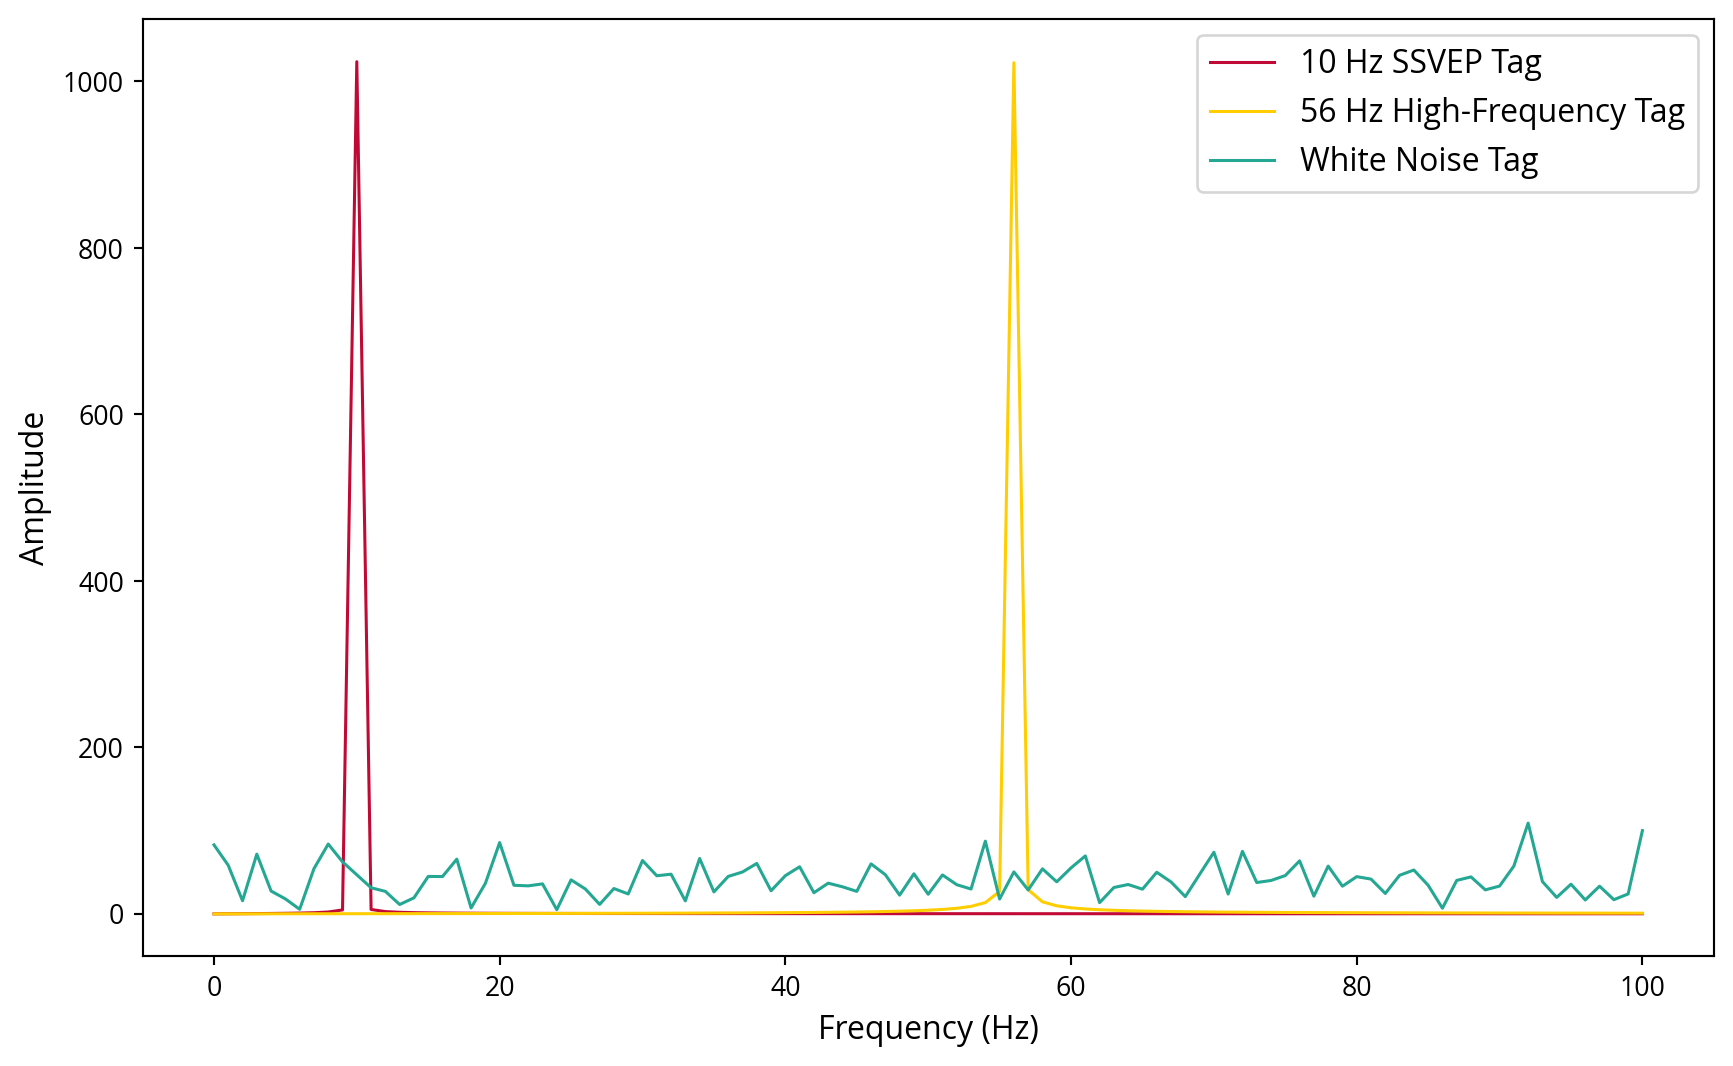
It is hypothesised that there are a number of advantages to the use of noise tags as an alternative to fixed frequency tagging techniques. Firstly, a single frequency signal, such as a sine wave, has all its energy concentrated at one frequency (narrow band). In contrast, noise has energy distributed across a range of frequencies. Consequently, while the power per unit of frequency may be lower, the total power over a wider band can be higher. Wideband signals are more readily detectable in noisy environments and are more resistant to interference. As the amount of information that can be reliably transmitted is proportional to the bandwidth (Shannon–Hartley theorem) (Shannon 1948), this could result in improved extractability.
2 Data Acquisition
This chapter presents an overview of the data collected and examined in order to address the research questions posed in this thesis. In particular, this study aims to ascertain whether noise-based tags can be extracted from EEG data and, if so, whether multiple noise-based tags can be used to determine where a user is directing covert attention.
To investigate these questions, a series of experiments were conducted in which test patterns containing frequency tags were presented to participants. The patterns were embedded with high-frequency white noise tags that are imperceptible to human vision but detectable in EEG recordings. During each trial, participants were exposed to these visual stimuli while their brain activity was measured using EEG. The collected EEG data was then subjected to various preprocessing and analysis techniques to extract and evaluate the noise-based tags, with the aim of determining their efficacy in identifying the focus of covert attention.
2.1 Participants
Three participants (one female, two males) were recruited for this study, all of whom were members of the thesis research team. Participant selection was influenced by the constraints of timely access and availability, with an emphasis on familiarity with the experimental setup and procedures. Informed consent was obtained from all participants, who were briefed on the study objectives and the data collection and data storage process. The study was conducted in accordance with the protocol approved by the Faculty of Social and Behavioural Sciences Ethics Committee at Utrecht University.
2.2 Experimental Setup
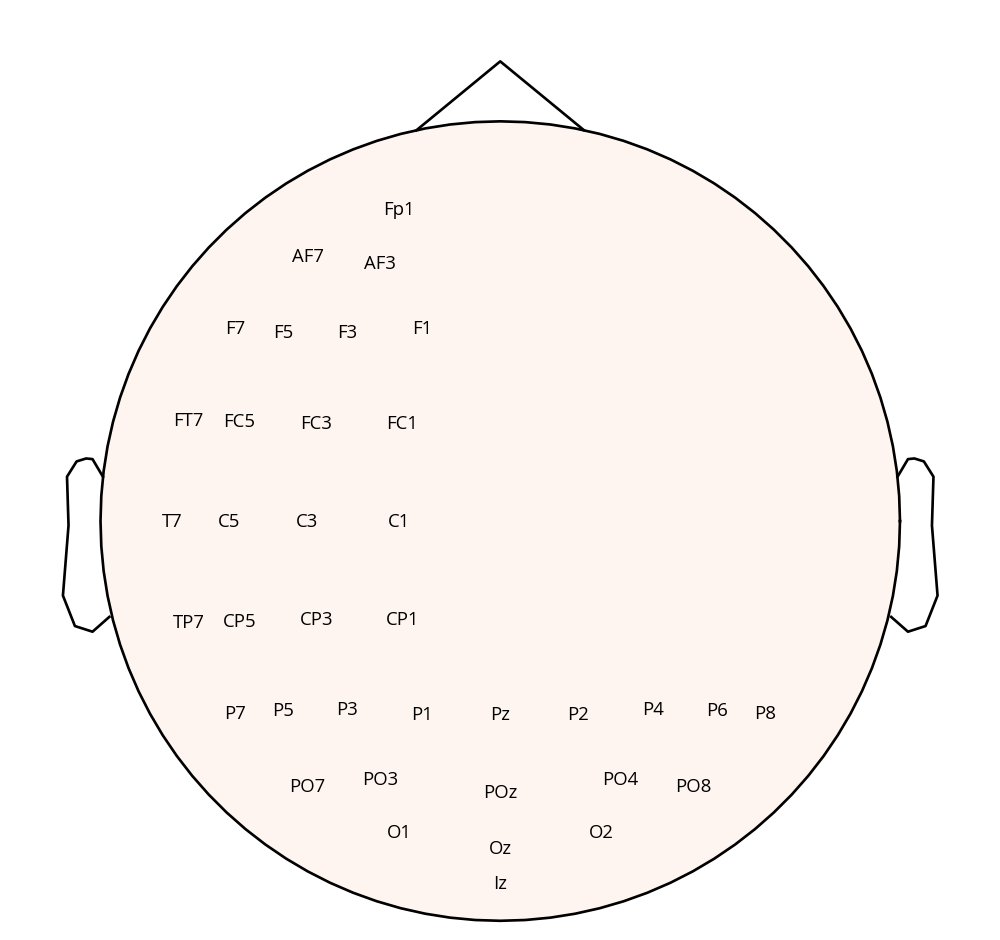
The experimental setup utilised a ‘PROPixx - VPixx Technologies’ (n.d.) projector from VPixx Technologies, configured at a refresh rate of 480 Hz in a rear-projection format. The dimensions of the projection screen were 48 x 27.2 cm. The experimental stimuli were generated and controlled using custom ‘MATLAB’ (n.d.) software, which made use of the PsychToolBox (Brainard 1997) (Kleiner, Brainard, and Pelli 2007). EEG data was recorded using a 64-channel BioSemi ActiveTwo system, with a sampling rate of 2048 Hz. Two additional electrodes were positioned above and on the outer canthus of the left eye, respectively, to record vertical and horizontal eye movements. Prior to the experiment, signal quality from all channels was verified using BioSemi ActiView software. To optimise data collection efficiency, a subset of 37 electrodes was used, placed according to the 10-20 system, shown in Figure 3.
2.3 Experiment Design
The experiment was designed to assess the extractability of noise-based tags in EEG data. Each participant underwent 150 trials. Each trial was structured to induce SSVEPs through the presentation of high-frequency noisy flickering stimuli, organised into a well-defined sequence of phases.
2.3.1 Trial Sequence and Randomisation
The experiment comprised several blocks, each containing a randomised combination of trials with either frequency-based or noise-based tagging conditions. The different tagging conditions refer to the type of signal presented to the participants, which was either a specific frequency tag or a noise tag. To control for potential order effects and to reduce predictability, trials were randomised. During each block, participants were exposed to various tagging conditions in different phases, ensuring a comprehensive assessment of both methods. To prevent fatigue and maintain data quality, participants were given short breaks between blocks.
2.3.2 Trial Structure
Each trial comprised multiple phases, including a fixation period, cue presentation, stimulus presentation, and a response interval. The sequence and timing of these phases are illustrated in Figure 4. A more simplified illustration of what was displayed on the screen throughout the trial can be seen in Figure 5.
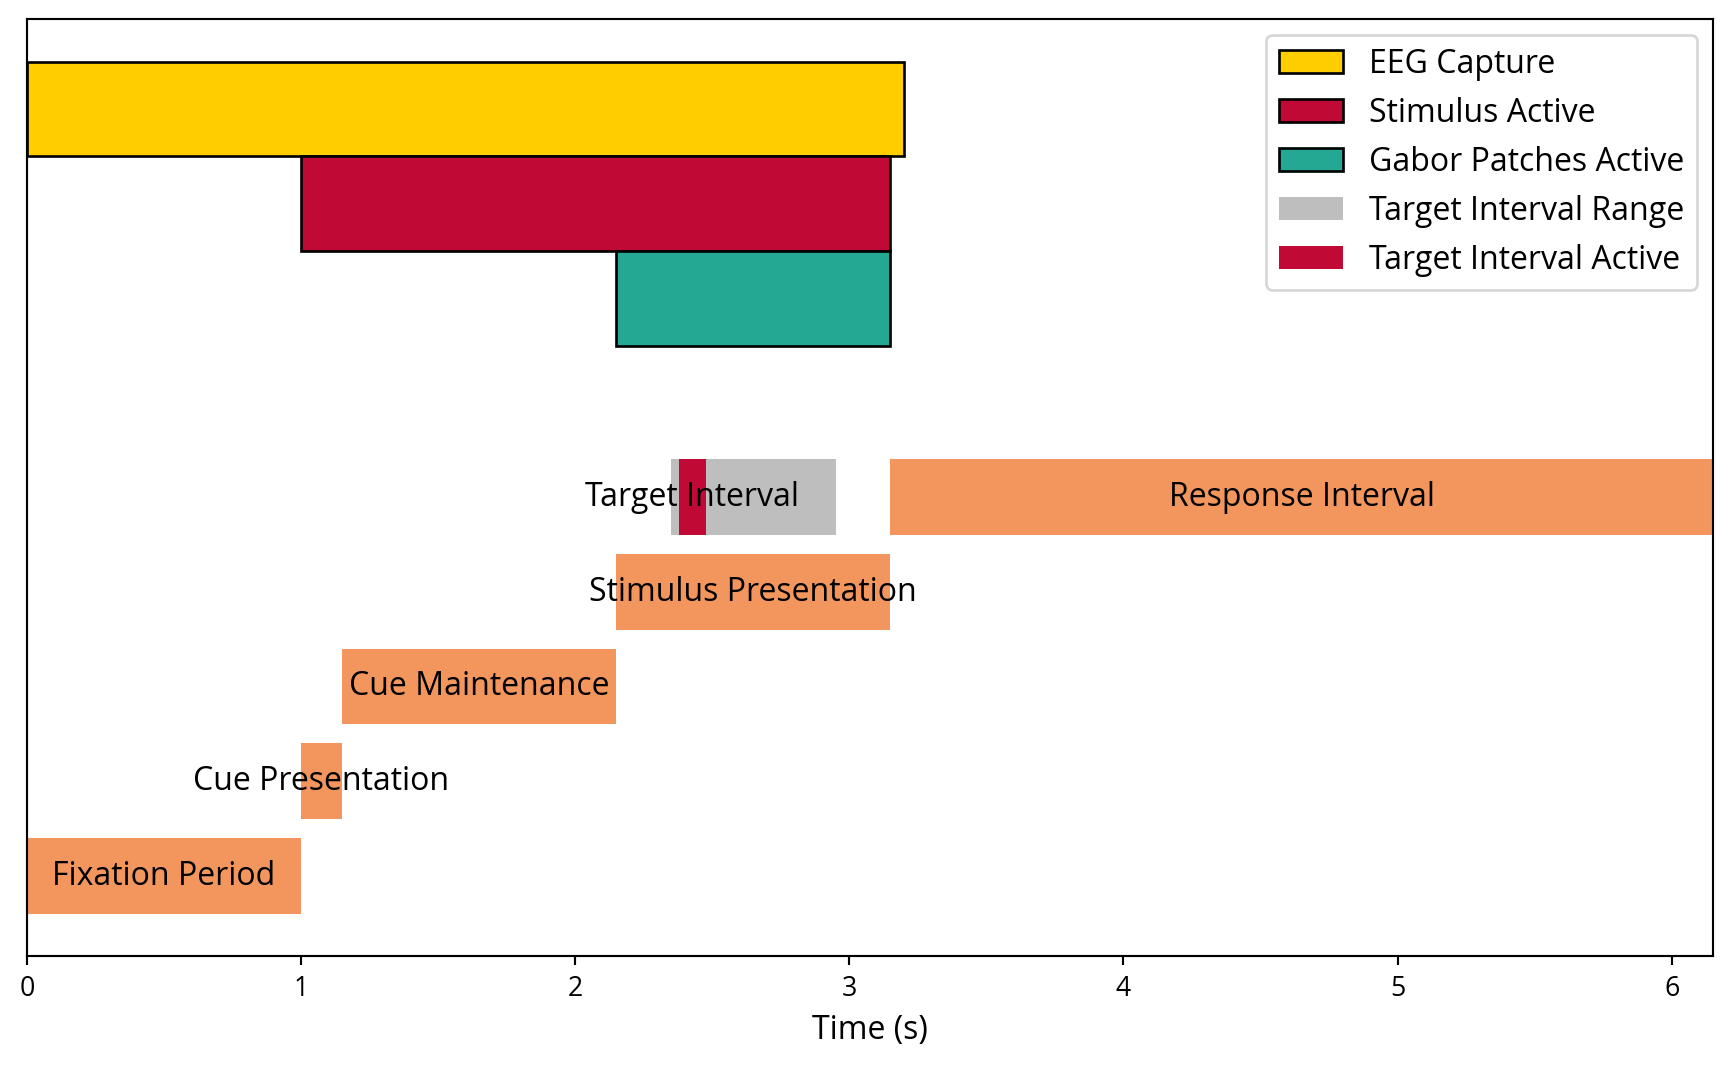
The following section provides a concise overview of the experimental phases.
Fixation Period: Each trial began with a pre-trial fixation period of 1 second. During this period, participants focused on a central cross to minimise eye movement artefacts.
Cue Presentation: This phase involved displaying a cue for 0.15 seconds, which was used to direct the participant’s attention to the upcoming stimulus location. The cue represented an arrow pointing to the left or right of the screen.
Cue Maintenance: Following the presentation of the cue, a maintenance period of 1.0 second was initiated, during which the participants continued to fixate on the cross, anticipating the subsequent stimulus. At this juncture, the noise tags had already been presented.
Stimulus Presentation: The Gabor patches were presented for a duration of 1.0 seconds, with the noise tags embedded in the stimuli. During this timeframe, the Gabor patch could be optionally rotated for a brief moment. The task for the participant was to focus on this and answer a question about it in the following stage. The duration of the rotation would only last for 0.15 seconds if it happened, and the amount of rotation was dynamically adjusted based on how well the participant was doing. This was done to maintain a challenging task.
Response Interval: Following the presentation of the stimulus, participants were required to respond within a 3.0-second interval. This involved pressing a button to indicate whether the gabor patch had undergone a previous rotation or remained static.

2.4 Data Preparation for Analysis
The EEG data was subjected to preprocessing using a combination of FieldTrip (Oostenveld et al. 2010) functions in order to ensure the generation of high-quality data for subsequent analysis. The preprocessing steps included the loading of the data, the segmentation of the data into trials, the removal of artefacts, and the re-referencing of the data. The exact steps in order are outlined in the sections below.
2.4.1 Loading and Segmenting Data
The raw EEG data was loaded from BDF files. Trials were defined based on specific triggers, with a pre-stimulus window of 1 second and a post-stimulus window of 2.3 seconds.
2.4.2 Artefact Removal
Visual inspection and automated methods were used to identify and remove bad channels and trials. Bad channels were manually specified and removed. Example of a bad channel is one that’s not connected properly. Bad trials could be identified by big events in the EEG data, such as eye blinks or muscle movements.
2.4.3 Re-referencing and Filtering
The EEG data were referenced to a common average, a technique that involves averaging the signal across all electrodes and subtracting this average from the signal from each individual electrode. This step helps to reduce noise and improve the detection of brain activity patterns by normalising the data. A high pass filter was applied to remove low frequency drifts that can be caused by slow movements or sweating. The cut-off frequency of the high-pass filter was chosen based on its effectiveness in removing these unwanted low-frequency components without affecting the relevant brain signals. In addition, notch filtering was applied to remove 50 Hz (or 60 Hz, depending on the region) power line noise, which is a common interferer in EEG recordings. This step ensures that the power line noise did not obscure the neural signals of interest.
2.4.4 Independent Component Analysis (ICA)
ICA (Hyvärinen and Oja 2000) was performed to identify artefacts related to eye movements such as blinks and saccades. Components identified as artefacts were removed from the data.
2.4.5 Data Enrichment and Bad Trial Rejection
The cleaned data was augmented with additional features, including reaction times, stimulus orientation and tagging types. Bad trials, e.g. those with visual artefacts or excessive noise, were excluded based on manual analysis.
3 Methods
The primary research question of this study is to determine whether noise-based tags can be effectively extracted from EEG data. This translates to a data science question: can high-frequency noise signals embedded in EEG recordings be accurately retrieved using signal processing techniques? By “accurate”, it is meant that there is a high signal-to-noise ratio (SNR) in the extracted noise tags, which results in a significant difference between the attended and unattended sides.
3.1 Cross-Correlation Analysis
A cross-correlation analysis was conducted to ascertain the presence and intensity of noise tags in the EEG data. The noise tags were identified through the use of a combination of left and right noise stimuli, with the results being presented in a visual format for a range of EEG channels. The primary focus was on the occipital channels, which are known to be involved in visual processing.
3.2 Signal-to-Noise Ratio Calculation
The cross-correlations were used to calculate the SNR in order to quantify the strength of the noise tags in the EEG recordings. The SNR values were subsequently represented graphically using a topographical plot.
3.3 Coherence Analysis
A coherence analysis was conducted to assess the relationship between the EEG signals and the noise stimuli in both cued and uncued conditions. The coherence was calculated for each trial and aggregated across all trials.
3.4 Classification of Attended Side
Three classifiers, including Logistic Regression, Linear Discriminant Analysis (LDA), and Support Vector Machine (SVM), were trained to predict the attended side based on the extracted features from the coherence analysis. The performance of these classifiers was evaluated using train-test split averaging and Monte-Carlo cross-validation. A t-test was conducted to assess the statistical significance of the classifier performance, with the baseline accuracy for random guessing set at 50%.
4 Exploration
To investigate the possibility of extracting the high-frequency noise tags, the data was explored in phases using various analysis methods. The exploration was conducted in a phased manner, with each phase guided by the results of the previous phase. The different phases correspond to different analysis methods and are presented in chronological order below. For the first phase, the aim was to find the noise tags in the EEG data. Given that noise tags are not fixed frequencies, traditional frequency domain analysis methods were not deemed applicable. Instead, time-domain analysis using cross-correlations was employed to examine the temporal relationship between the noise tags and the EEG signals. Upon completion of the initial phase, the subsequent phase sought to classify the attended side based on the extracted features identified in the preceding phase.
4.1 Cross-Correlation Analysis
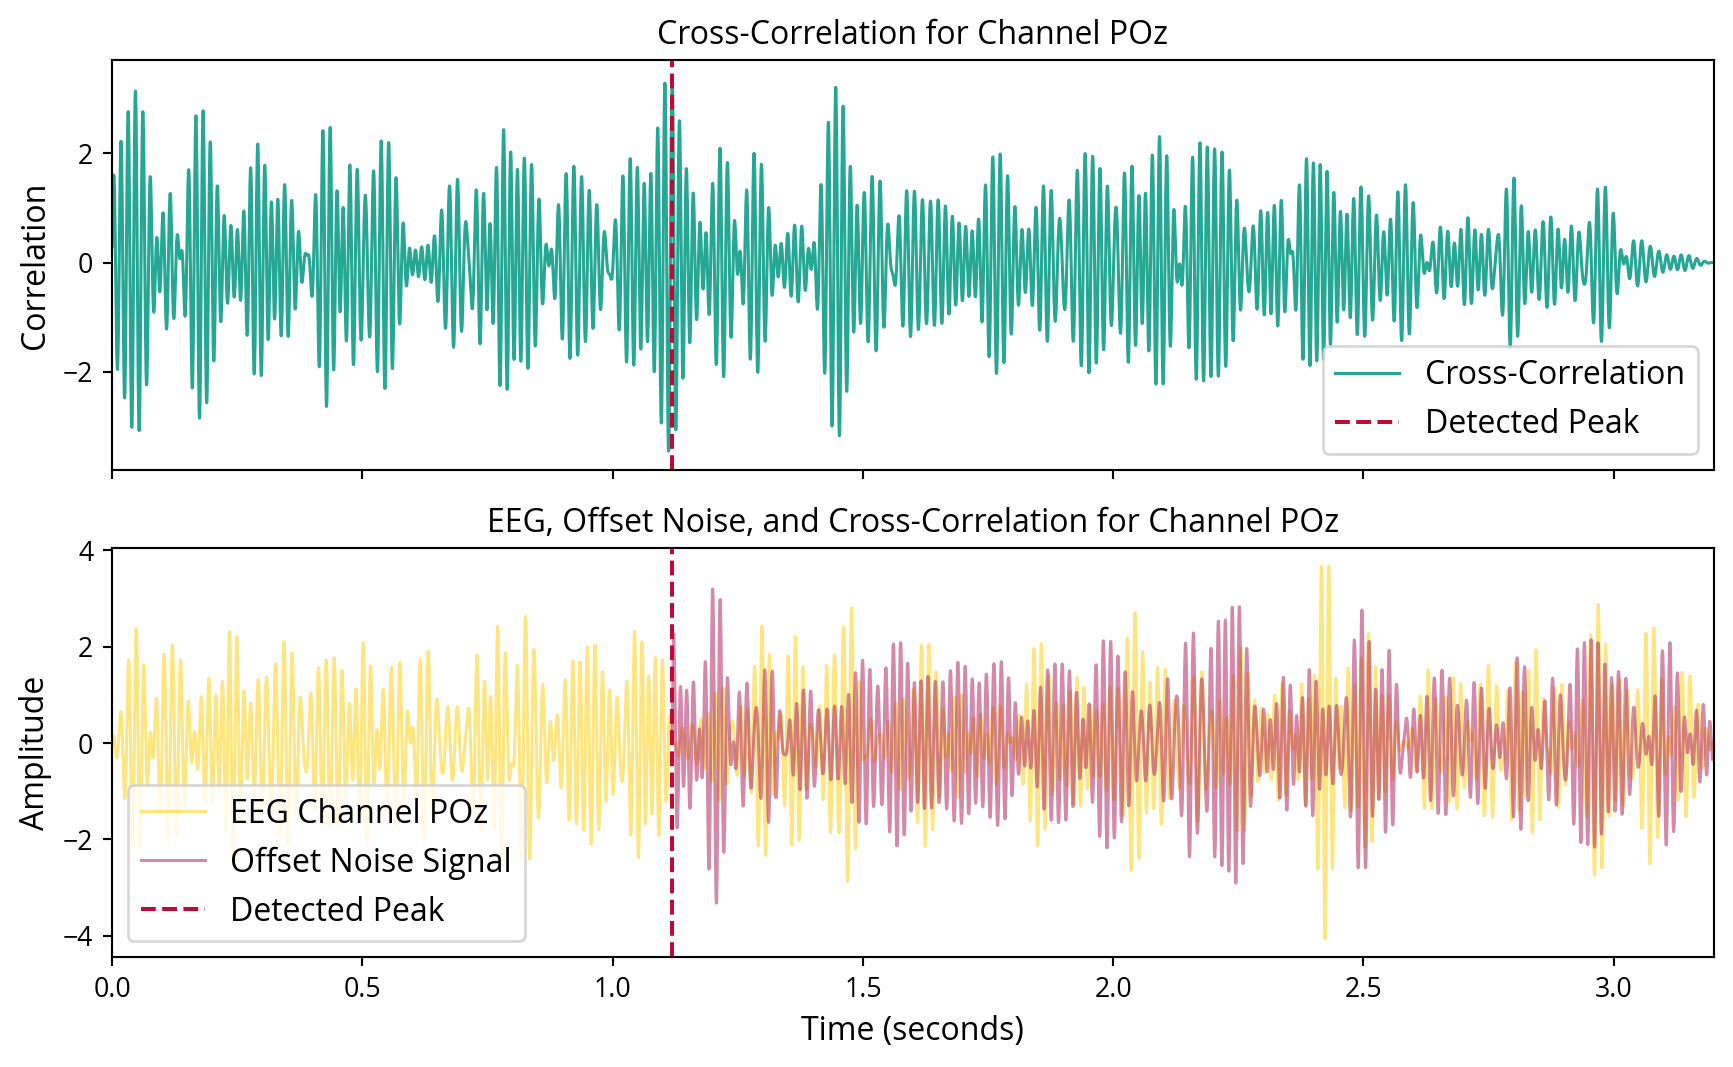
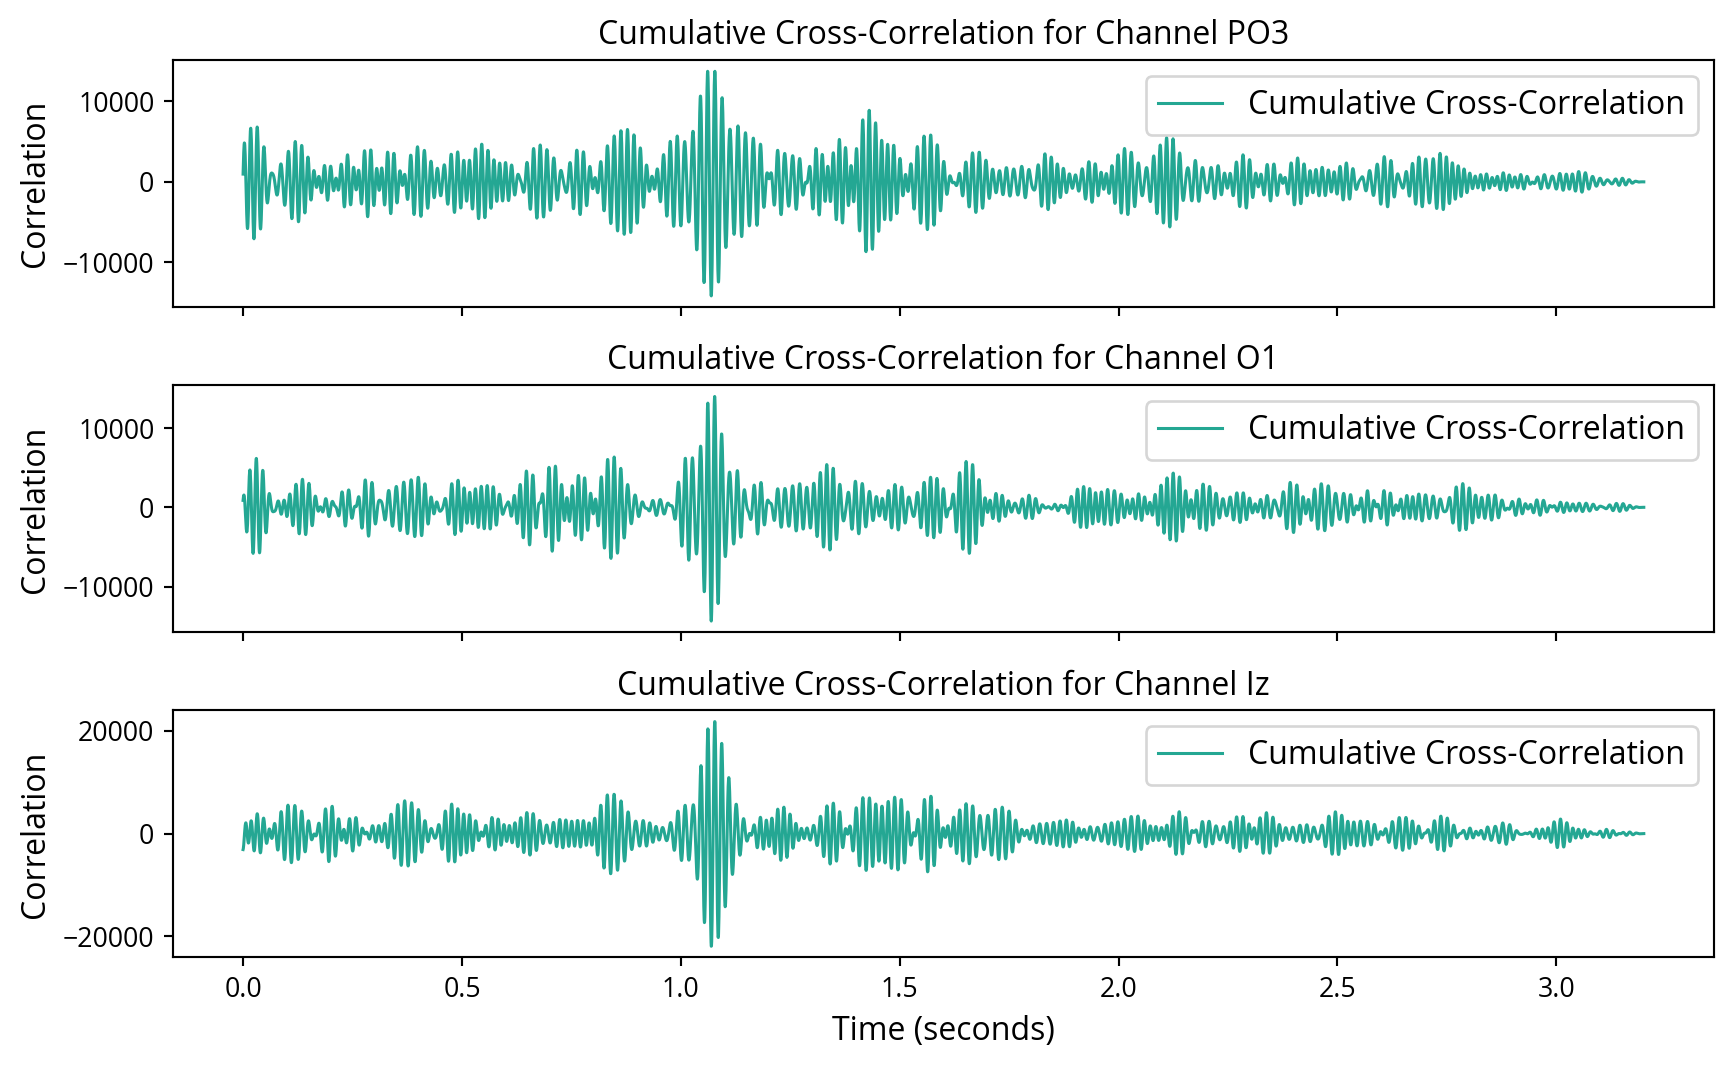
Initially, cross-correlation was employed with the objective of identifying the presence of noise tags in the EEG recordings. These methods were selected for their efficacy in identifying known signals within noisy data, as they maximise the SNR for detecting specific patterns. At first, this approach yielded unsatisfactory results. Attempting to discern the left and right noise tags individually proved challenging. However, by combining the left and right noise tags into a single noise tag, the results markedly improved, leading to a clear detection of the noise tags in the EEG data. Even for single trials, these mixed noise tags seemed to show up in the cross correlations, but were drown out by other noise as seen in Figure 6. To improve the SNR, the cumulative cross-correlation was calculated across all trials, which yielded enhanced results, as demonstrated in Figure 7.
4.2 Signal-to-Noise Ratio Calculation
From the cross-correlation results, SNR values were calculated to quantify the strength of the noise tags in the EEG recordings. The SNR was calculated using the formula:
\[ \text{SNR} = 10 \cdot \log_{10} \left( \frac{\text{peak\_signal}^2}{\text{noise}^2} \right) \]
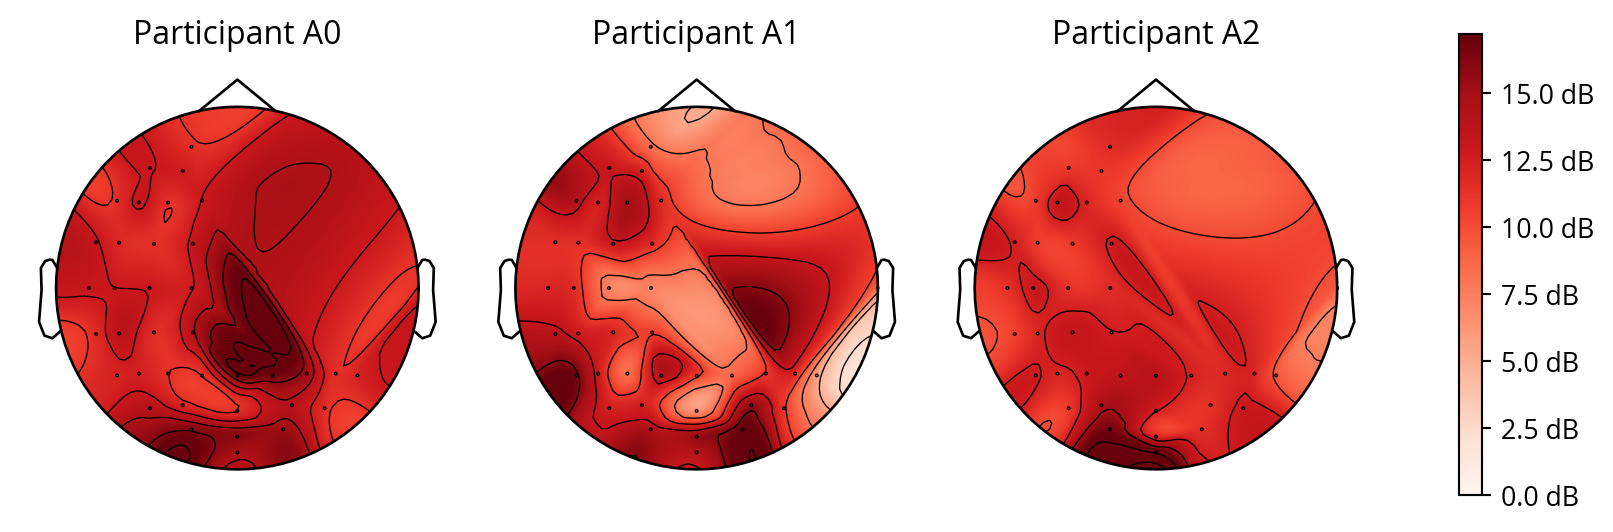
where \(peak\_signal\) represents the highest peak in the cumulative cross-correlation and \(noise\) is calculated as the standard deviation of the cumulative cross-correlation. This demonstrated that the noise tags were most pronounced in the occipital region, which is known to be involved in visual processing. This effect can be best seen with participants A0, and A2, as shown in Figure 8, this may indicate the experiment for participant A1 was not succesful.
4.3 Lag Calculation
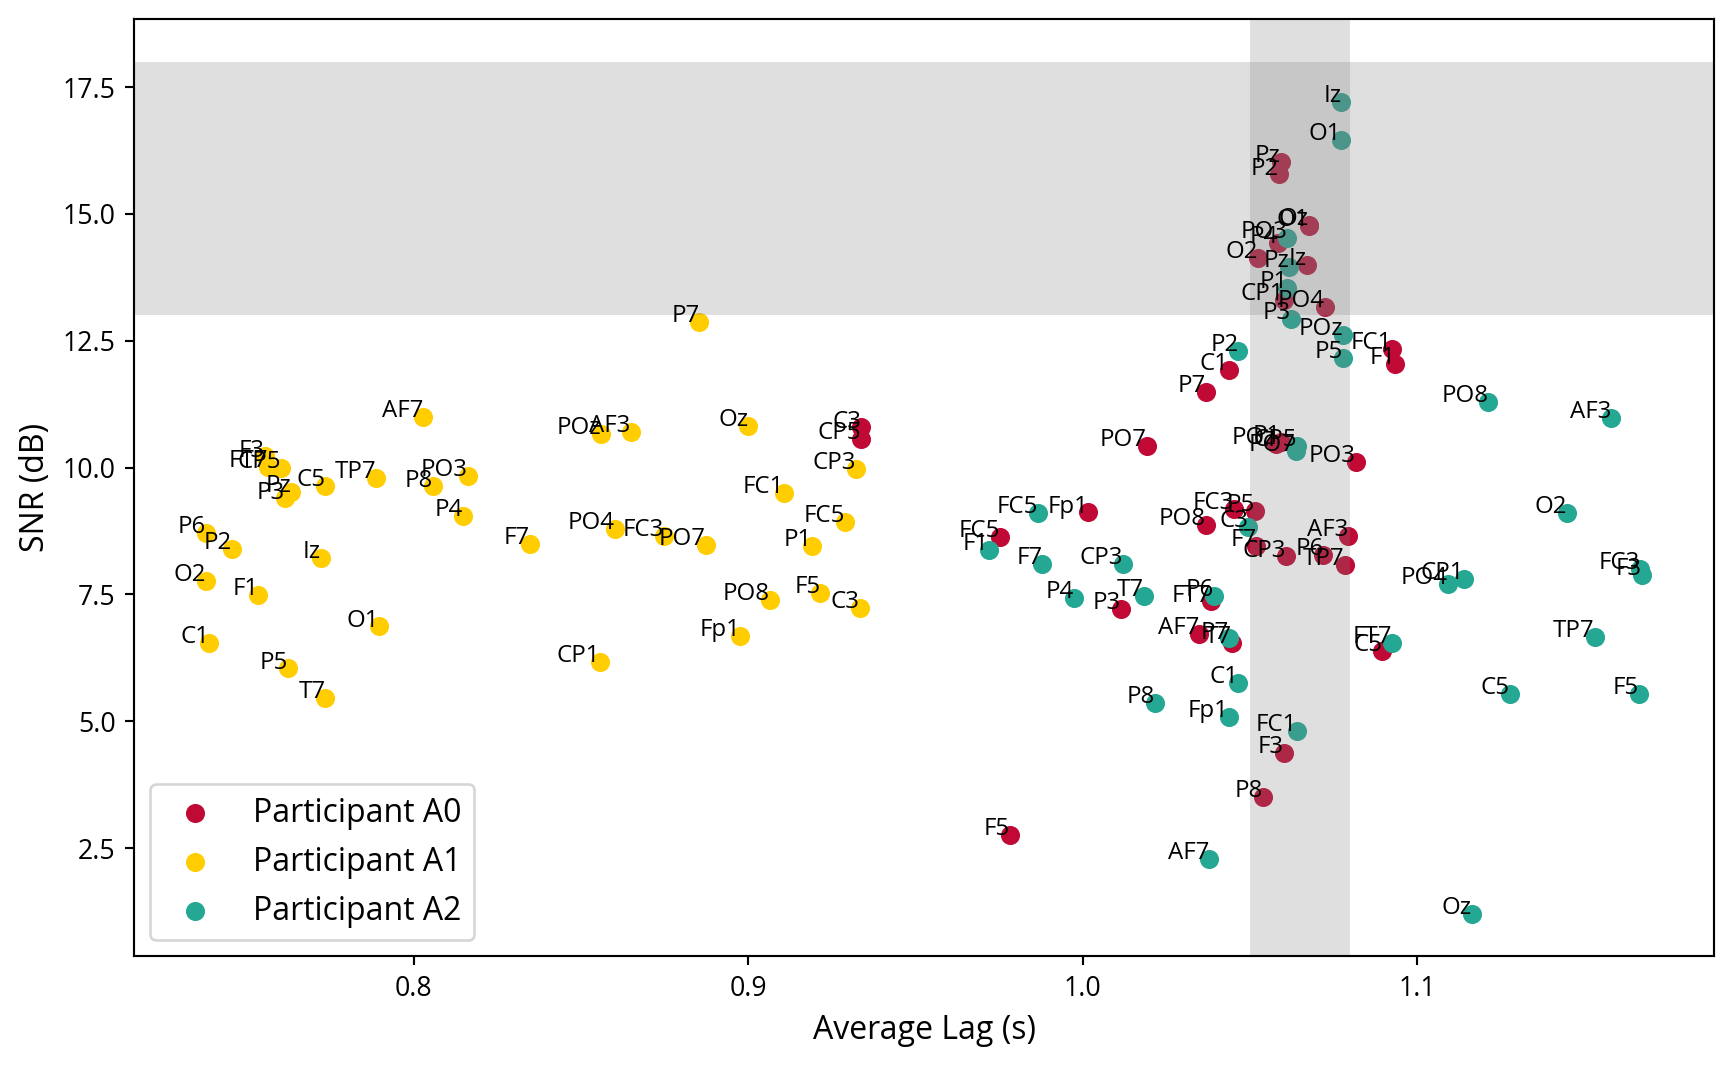
Given the knowledge of when the strongest cross correlations of the noise signal occurs inside the EEG signal, it is now possible to calculate a lag. This is the interval between the display of the noise tag by the program and its subsequent measurement in the brain. Given that the stimulus is presented at the one-second mark in the trials, it is anticipated that this peak will occur just behind it. Each channel has its own lag, but only those with a strong SNR are used to calculate the average lag. This average lag will be used to align the noise tags with the EEG data in future analysis. In Figure 9, the average lag in each channel is plotted against the channels SNR, thereby confirming that the channels with a high SNR exhibit similar lags, as evidenced by the grey coloured region of interest. Furthermore, it demonstrates that the experiment conducted with participant A1 was unsuccessful, as the lags are highly variable and occur before the onset of the stimulus at the one second mark.
4.4 Coherence Analysis
The next step is to determine whether it is possible to identify which noise tags the user paid covert attention to. This is done by calculating which frequency components contribute most to the signal. A coherence score is calculated for each frequency component.
In order to compute coherence, it is first necessary to select the segments of EEG data and noise stimuli. These segments are resampled to match their sampling rates. The signals are then normalised before coherence is calculated. For each channel, the EEG signal is aligned with the noise stimuli using the previously calculated lag.
The coherence between two signals \(x(t)\) and \(y(t)\) is defined as:
\[ C_{xy}(f) = \frac{|\text{P}_{xy}(f)|^2}{\text{P}_{xx}(f) \cdot \text{P}_{yy}(f)} \]
where \(\text{P}_{xx}(f)\) and \(\text{P}_{yy}(f)\) are the power spectral density estimates of \(x(t)\) and \(y(t)\), respectively, and \(\text{P}_{xy}(f)\) is the cross spectral density estimate of \(x(t)\) and \(y(t)\).
In the implemented code, the Welch method (Welch 1967) is used to estimate the power spectral densities and cross spectral densities (Stoica and Moses 2005). The coherence is computed as follows:
- Select segments of EEG data and noise stimuli by aligning them using the previously calculated lag.
- Resample the signals to match their sampling rates.
- Normalise the signals.
- Calculate the coherence score.
- Retry steps 1-4 for different lags in a small range of a few samples around the previously calculated lag.
- Determine the best lag that maximises the sum of coherence scores.
- Recompute the coherence with the best lag.
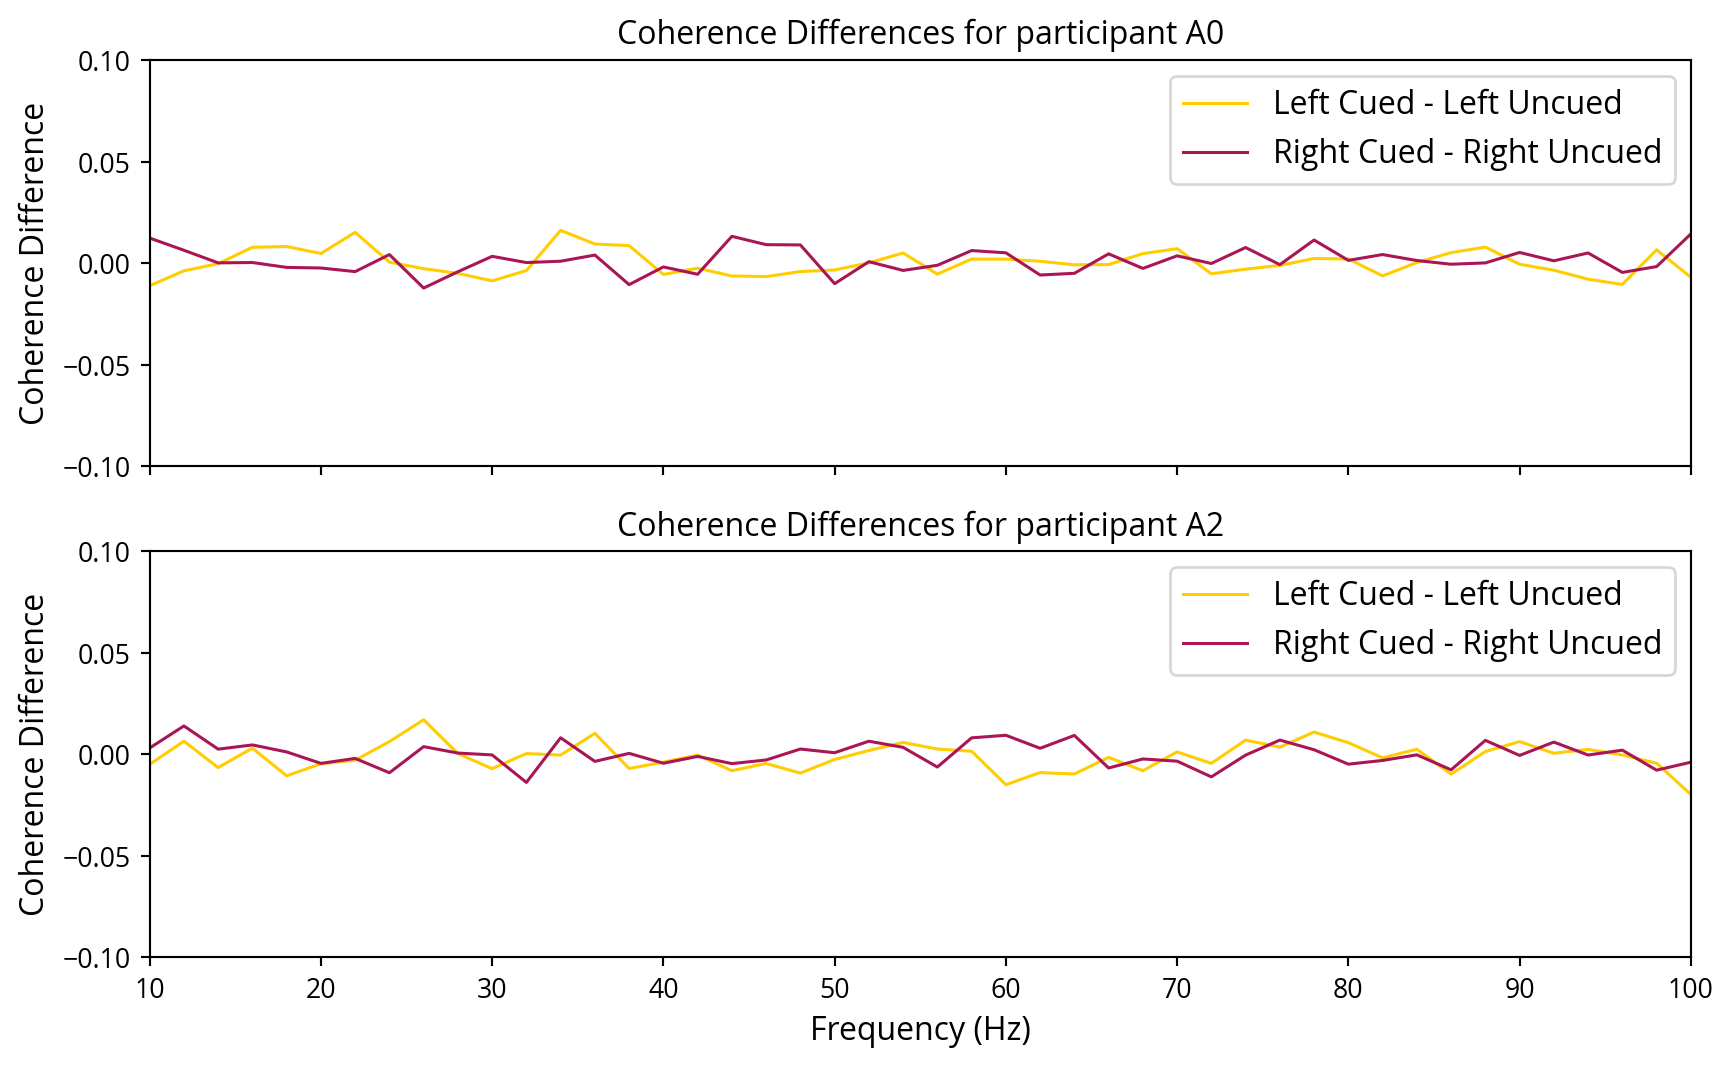
The formula used to calculate the coherence score for each frequency component helps in identifying which frequency components contribute most to the signal, thus determining the noise tags the user on focused to. Figure 10 represents the differences in coherence over the frequency spectrum for the cued and uncued sides. This figure presents the mean difference for all channels with a strong SNR at the same lag. It should be noted that the results for participant A1 did not yield any outcomes with a strong SNR and, therefore, have been excluded from the graph.
4.5 Classification of Attended Side
The coherence differences graphs do not demonstrate a clear distinction between the cued and uncued sides. A straightforward “majority voting” method was employed whereby the side with the highest coherence in the channels that displayed a strong signal-to-noise ratio (SNR) was selected as a baseline. Subsequently, various classifiers were trained with the objective of distinguishing between the two. The classifiers were provided with complete coherence data as input and were trained to predict which noise tags the user was covertly attending to.
5 Results
6 Discussion and Conclusion
This thesis investigated the feasibility and effectiveness of utilising noise tagging, composed of high-frequency white noise, for enhancing BCIs. Through a series of experiments involving EEG data analysis, cross-correlation, SNR calculations, coherence analysis, and classifier performance evaluation, several key findings were established.
Detection of noise tags: The cross-correlation analysis EEG data, particularly in the occipital region, which is involved demonstrated that noise tags could be effectively detected in the in visual processing.
Signal strength: The SNR calculations demonstrated that the noise tags were significantly stronger in the occipital channels.
Classifier performance: Various classifiers were able to predict the attended side with an accuracy significantly better than random guessing, although the accuracy was not exceptionally high.
6.1 Interpretation and Implications
The findings indicate that noise-based tags have the potential to be a viable alternative to traditional RIFT methods. While the accuracy achieved in this study is not exceptionally high, it is not far behind the performance levels reported for RIFT methods. This suggests that noise tagging could become a competitive technique for BCIs with further refinement.
6.2 Potential for Improvement
A number of avenues for improving the performance of noise-based tagging in BCIs have been identified. These include enhanced noise signal generation and the exploration of more advanced classifiers, such as deep learning models. Continued research into the optimal parameters for noise tagging, such as frequency ranges, would be beneficial. Additionally, increasing the sample size and diversity of participants can help in generalising the findings. Furthermore, integrating noise tagging with other BCI techniques could leverage the strengths of each method, potentially leading to superior overall performance. For instance, noise tagging could be combined with frequency tagging, with frequency tagging employed to rapidly identify lags, given that analysis in the frequency domain is easier. This would be followed by noise tagging, which would utilise the full bandwidth of the EEG signal. Finally, it would be of interest to explore alternative test methods. One possibility would be to rapidly flicker between the two sides, effectively demultiplexing the signal between the two sides. This would be an interesting approach, as it would only be necessary to find one signal, and it would be possible to rapidly compare coherence between the two sides against itself.
6.3 Limitations
It is important to acknowledge the limitations of this study. Firstly, the sample size was extremely small, which limits the generalisability of the findings. Secondly, the experiments were conducted using a specific setup and parameters, which may not be optimal for all applications. Thirdly, while the classifiers performed better than random guessing, the accuracy levels achieved are moderate and leave room for improvement.
6.4 Conclusion
In conclusion, this study has demonstrated the potential of noise-based tagging as a promising tool for BCIs. Although the achieved accuracy levels were moderate, the results indicate that with further research and refinement, noise tagging could offer a viable and potentially superior alternative to existing methods. The insights gained from this research provide a foundation for future work aimed at improving the usability and reliability of BCI systems.
References
Arora, Kabir, Surya Gayet, J. Leon Kenemans, Stefan Van der Stigchel, and Samson Chota. 2024. ‘Rapid Invisible Frequency Tagging (RIFT) in a Novel Setup with EEG’. 4 February 2024. https://doi.org/10.1101/2024.02.01.578462.
Brainard, David H. 1997. ‘The Psychophysics Toolbox’. Spatial Vision 10 (4): 433–36. https://doi.org/10.1163/156856897X00357.
Brickwedde, Marion, Yulia Bezsudnova, Anna Kowalczyk, Ole Jensen, and Alexander Zhigalov. 2022. ‘Application of Rapid Invisible Frequency Tagging for Brain Computer Interfaces’. Journal of Neuroscience Methods 382 (December): 109726. https://doi.org/10.1016/j.jneumeth.2022.109726.
Haegens, Saskia, and Elana Zion Golumbic. 2018. ‘Rhythmic Facilitation of Sensory Processing: A Critical Review’. Neuroscience & Biobehavioral Reviews 86 (March): 150–65. https://doi.org/10.1016/j.neubiorev.2017.12.002.
Hyvärinen, A., and E. Oja. 2000. ‘Independent Component Analysis: Algorithms and Applications’. Neural Networks 13 (4): 411–30. https://doi.org/10.1016/S0893-6080(00)00026-5.
Kleiner, Mario, David Brainard, and Denis Pelli. 2007. ‘What’s New in Psychtoolbox-3?’ https://pure.mpg.de/rest/items/item_1790332/component/file_3136265/content.
‘MATLAB’. n.d. Accessed 19 June 2024. https://nl.mathworks.com/products/matlab.html.
Oostenveld, Robert, Pascal Fries, Eric Maris, and Jan-Mathijs Schoffelen. 2010. ‘FieldTrip: Open Source Software for Advanced Analysis of MEG, EEG, and Invasive Electrophysiological Data’. Computational Intelligence and Neuroscience 2011 (December): e156869. https://doi.org/10.1155/2011/156869.
‘PROPixx - VPixx Technologies’. n.d. Accessed 19 June 2024. https://vpixx.com/products/propixx/.
Shannon, C. E. 1948. ‘A Mathematical Theory of Communication’. Bell System Technical Journal 27 (3): 379–423. https://doi.org/10.1002/j.1538-7305.1948.tb01338.x.
Stoica, Petre, and Randolph L. Moses. 2005. Spectral Analysis of Signals. Pearson Prentice Hall. https://books.google.com?id=h78ZAQAAIAAJ.
Welch, P. 1967. ‘The Use of Fast Fourier Transform for the Estimation of Power Spectra: A Method Based on Time Averaging over Short, Modified Periodograms’. IEEE Transactions on Audio and Electroacoustics 15 (2): 70–73. https://doi.org/10.1109/TAU.1967.1161901.
Citation
BibTeX citation:
@online{halsema2024,
  author = {Halsema, Jan},
  title = {NOISE: {Noisy} {Oscillations} {Improving} {Signal}
    {Extraction}},
  date = {2024-07-16},
  langid = {en-GB},
  abstract = {Brain-computer interfaces (BCIs) facilitate direct
    communication between the brain and external devices, offering
    considerable potential to assist individuals with physical
    disabilities. Conventional tagging techniques, such as steady-state
    visual evoked potentials (SSVEP), necessitate the utilisation of
    low-frequency stimuli, which may induce user fatigue and impede the
    natural oscillatory processes of the brain. The emergence of Rapid
    Invisible Frequency Tagging (RIFT) represents a potential solution
    to these issues, utilising high-frequency, imperceptible stimuli to
    reduce visual strain and enhance BCI performance. This thesis
    presents an alternative approach, namely noise-based tagging using
    high-frequency white noise. A series of experiments involving EEG
    data collection and analysis was conducted to investigate the
    possibility of extracting noise-based tags and using them to
    determine the focus of covert attention. The results demonstrated
    that noise tags can be effectively detected in EEG data,
    particularly in the occipital region. Signal-to-noise ratio (SNR)
    calculations showed strong detection of noise tags, and classifier
    analysis revealed the potential to predict attended sides based on
    coherence data, albeit with moderate accuracy. The results of this
    study indicate that noise-based tagging represents a promising
    alternative to traditional methods, offering potential advantages in
    robustness and user comfort. Future research should focus on
    refining noise signal generation, exploring advanced classifiers,
    and integrating noise tagging with other BCI techniques to enhance
    overall system performance.}
}
For attribution, please cite this work as:
Halsema, Jan. 2024. “NOISE: Noisy Oscillations Improving Signal
Extraction.” Utrecht University. July 16, 2024.